The Greenhouse Effect
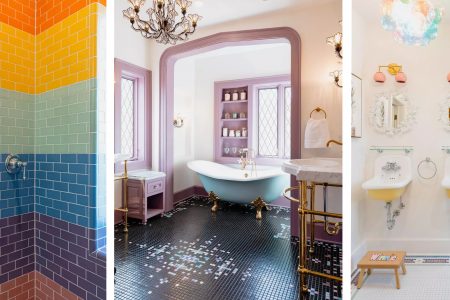
Greater D.C. residents used 3/8″ Vitreous Glass for the feature mosaic along with solid field tile to complete this highly personalized shower.
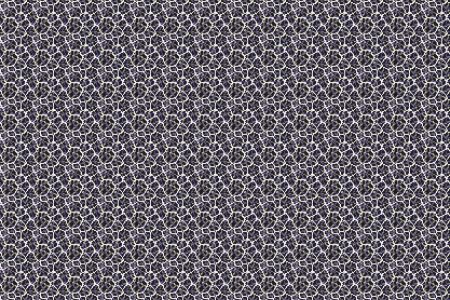
Their mosaic features a portion of a real ‘Climate Stripe’ graph which illustrates temperature change in the Americas between 1901 and today. Fitting since both husband and wife are – can you guess? Meteorologists!
Blue lines represent a cooling pattern year over year of up 1.5 degrees Celsius, while red lines represent a heating pattern of up to 1.5 degrees Celsius. The more saturated the hue – the more dramatic the increase or decrease. Moral of the story here is – it’s getting hot!
Interested in the finding out your areas climate changes over time? You can search any country or states climate change stripes over at www.climate.gov
Share
Download Above ImageInstallation Details
| Tile Type | Vitreous Glass |
|---|---|
| Application | Bathroom, Shower |
| Industry | Residential |